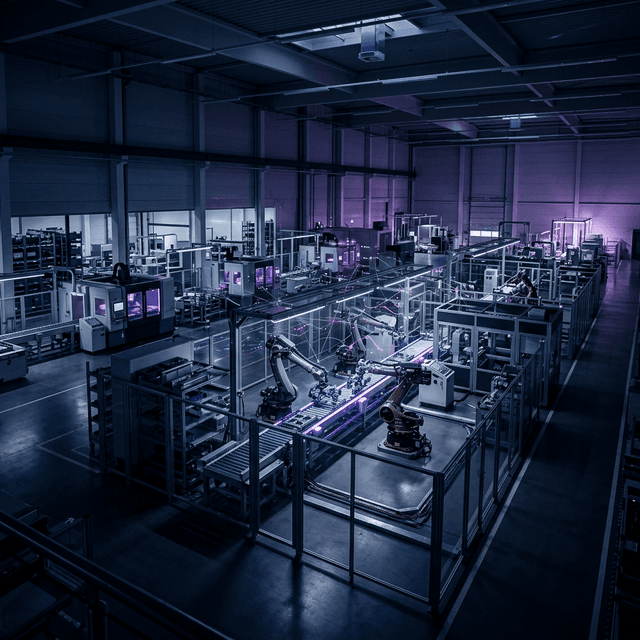
Your factory in real time.
Hardware + software in one ecosystem.
Collect data from machines and sensors, automate downtime declarations, run edge AI, and turn signals into concrete actions on the shop floor.
No hardware in the demo. The pilot runs on 1–3 workstations or a single line.
SOUND FAMILIAR?
Your factory is running — but how much is it losing?
Plants that don't measure in real time lose 20–30% OEE to causes nobody can explain within the same shift.
Downtime with no reason — €200–1,000/h gone
Machine stops. Operator logs "other". Someone checks an Excel sheet after the shift. The root cause never reaches the person who could fix it.
Data with a week's delay
Last week's report doesn't help this morning. SCADA collects data, but doesn't escalate or assign tasks. Decisions come too late.
Retrofit impossible without CAPEX
Enterprise IIoT platforms require infrastructure replacement or months of project work. Legacy machines? Separate project, separate budget, separate integrator.
Operator doesn't know if they're hitting target
No real-time feedback = no motivation to improve. Operators end their shift not knowing what went wrong. Problems repeat on the next shift.
Estimates based on industry benchmarks and pilot deployment results.
HOW IT WORKS
From machine to action — in 3 steps.
You don't need months of project work or infrastructure replacement. DBR77 IIoT works from day one of the pilot.
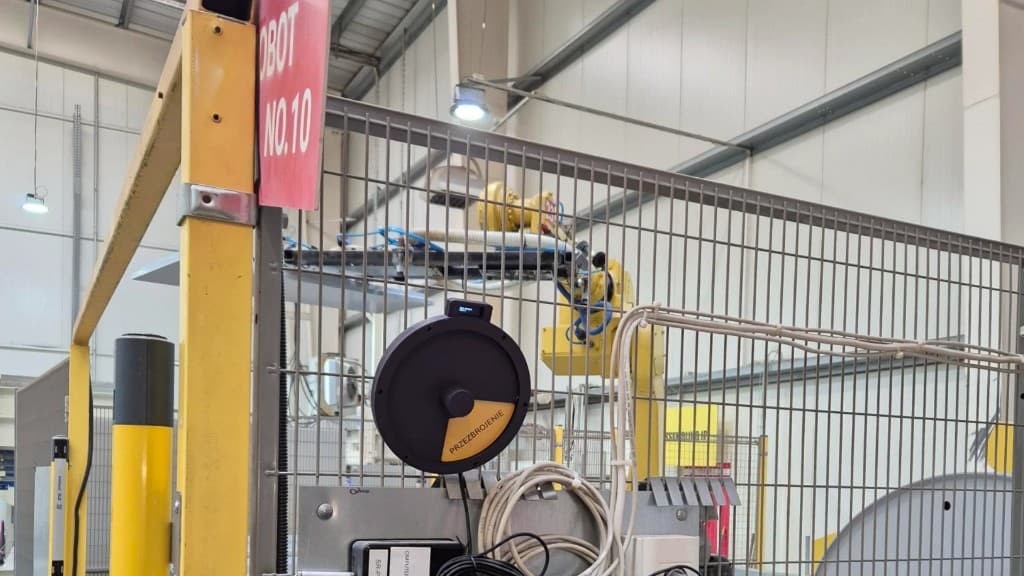
Connect
Status Deck mounts on any machine in minutes — no PLC, no IT project. Data Hub collects signals from multiple machines and protocols simultaneously.
Measure
OEE, availability, performance, and quality calculated automatically in real time. Operator logs downtime reason — one tap on a tablet.
Act
Alerts reach operators and maintenance before the shift ends. Managers see every machine's status live. Reports generate automatically.
OUTCOMES
Information and sales in one: first the outcome, then the architecture.
DBR77 IIoT collects shop-floor data and turns it into fast decisions: statuses, alerts, and insights.
No more “unknown downtime”
Capture real loss reasons (operator declarations + signals) and react faster with alerts.
Reliable OEE
See statuses, cycles, and losses in real time — instead of after-the-fact reports.
Quality & safety in real time (Edge)
Vision AI can run on the edge: lower latency and less data exposure.
Retrofit for legacy equipment
Status Deck + Data Hub let you start even without modern PLCs or OPC‑UA.
One data backbone
MQTT/Modbus/RS485/LoRaWAN/Wi‑Fi/LTE — a consistent stream without replacing infrastructure.
Data → decision → action
Alerts, escalation, and fast responses on the shop floor — without manual reporting.
DEPLOYMENTS
Plants already measuring.
Anonymous results from DBR77 IIoT pilots and deployments in European manufacturing plants.
Root causes of 80% of unplanned downtime identified within 3 weeks of pilot. OEE grew from 61% to 74% in 4 months.
Furniture manufacturing
~120 machines, 2 plants
ROI: ~7 mo.
Status Deck on 8 workstations — manual reporting eliminated. Fault response time cut from 23 to 6 minutes.
Food & beverage
1 packaging line
ROI: ~5 mo.
Data Hub deployed + ERP integration. Micro-downtime reduced by 34%. Real-time alerts to operators.
HVAC manufacturer
35 CNC machines
ROI: ~9 mo.
Client names anonymised. Results are from specific pilots and deployments — may vary by plant.
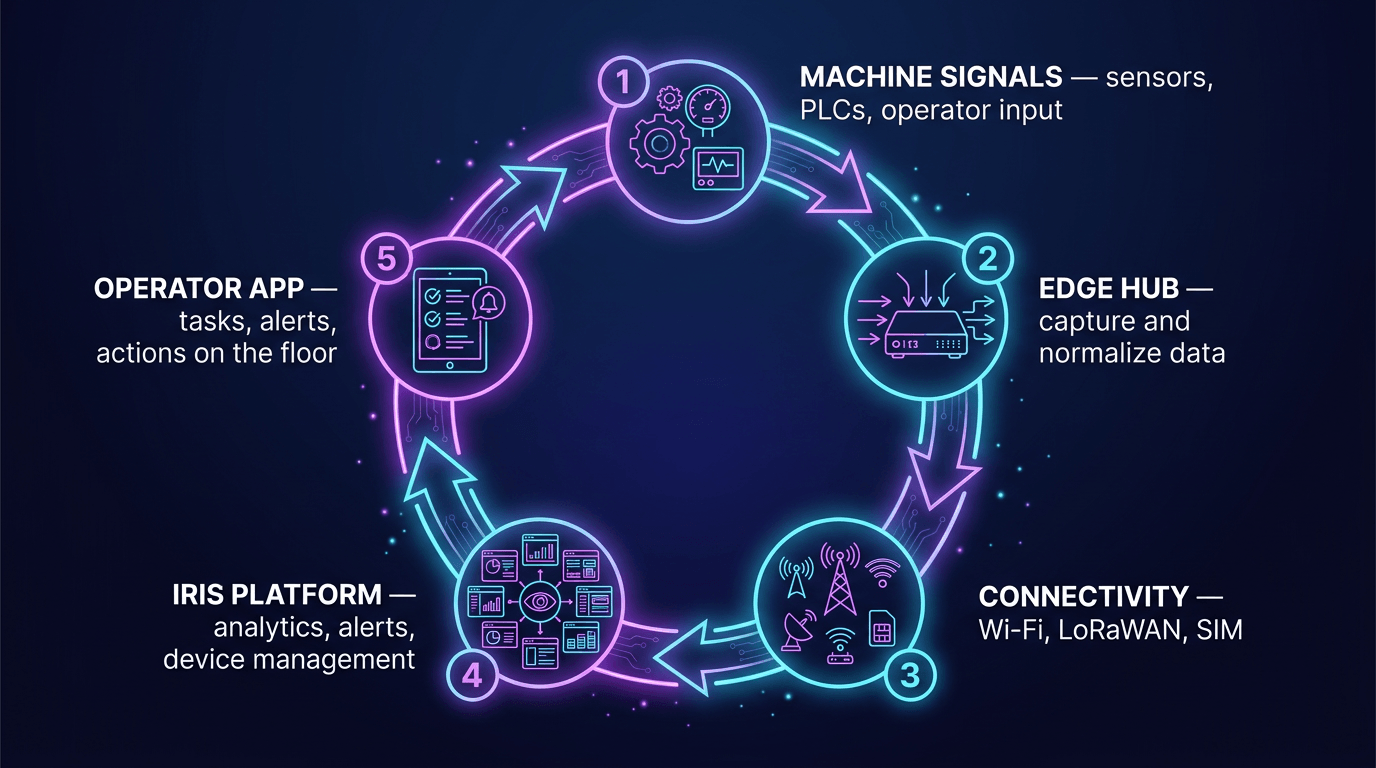
ARCHITECTURE
The Loop: from signal to action.
Data sources → edge & connectivity → IIoT panel → shop-floor action (mobile/tablet) → continuous improvement.
COMPONENTS
Hardware + software. One vendor. One accountability.
Start with the simplest data source, then scale — without lock‑in and without ripping out your infrastructure.
DBR77 Status Deck
HardwareA low-cost device for declaring machine state: Run / Break / Changeover / Breakdown.
- 2 seconds to the truth about downtime
- Perfect for legacy machines
- Fast installation on a workstation
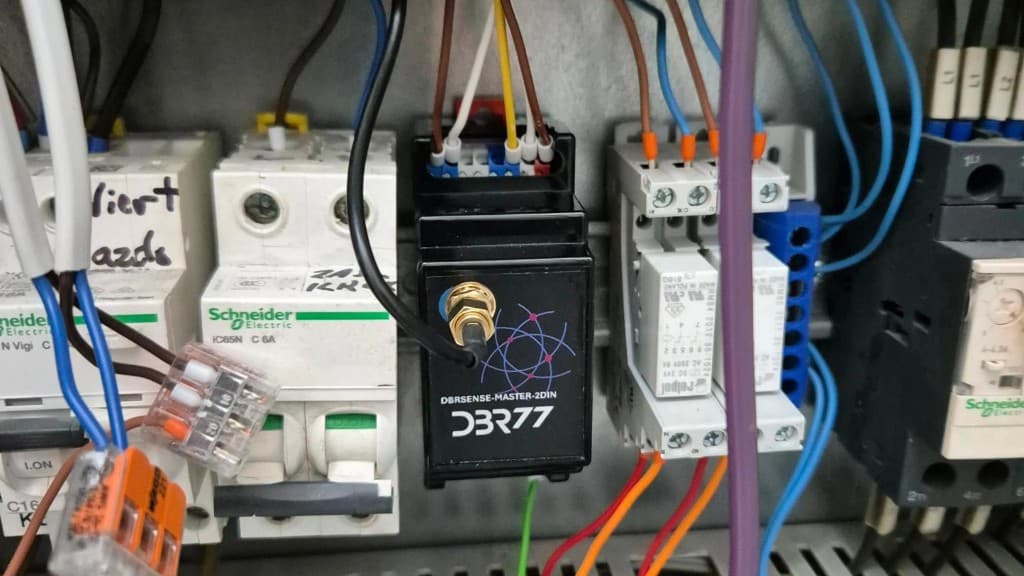
DBR77 Master / Data Hub
HardwareDIN-rail gateway: collects signals, ensures transmission quality, and delivers data to the IIoT panel.
- OT-grade cabinet installation
- Multi-protocol (MQTT/Modbus/RS485)
- Range and stability (LoRaWAN/Wi‑Fi/LTE)
Mobile & Tablet Apps
SoftwareTasks, checklists, and alerts at your fingertips — on phone and tablet.
- Tasks and shift plan
- Notifications and alert confirmations
- Faster decisions on the floor
DBR77 Vision AI (Edge)
Edge AI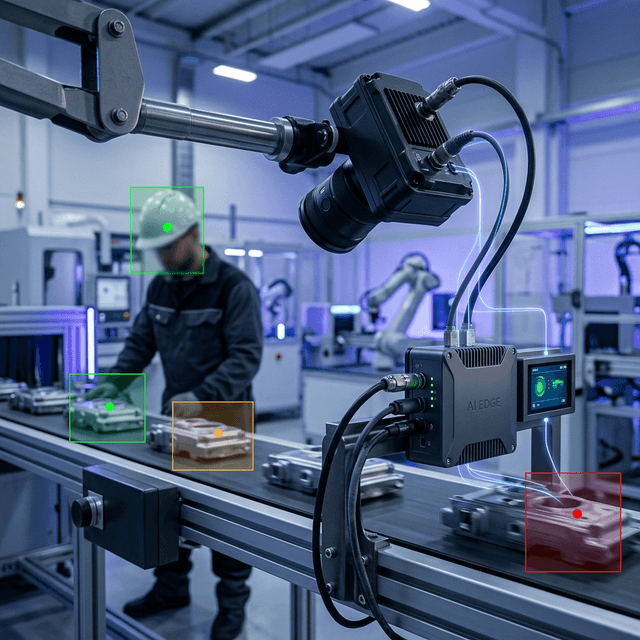
Safety (PPE), quality defects, presence, and process anomalies — with local processing where milliseconds matter.
- Zero-latency decisions
- Less data leaves the plant
- Optional integration with Digital Twin
Illustrative graphic — generated with AI.
COMPARISON
DBR77 IIoT vs. the market — who really fits your plant?
Buyers most often compare us with OEE-only tools (Evocon, Teeptrak) and enterprise platforms (ThingWorx, Cumulocity). Here's why DBR77 is the third way.
| Feature | DBR77 IIoT | OEE-only (Evocon, Teeptrak) | Enterprise platform (ThingWorx, Cumulocity) | Enterprise SCADA |
|---|---|---|---|---|
| Deployment time | <48h pilot, weeks full | ~1h (OEE only) | Months–years, needs SI | Weeks + external integrator |
| Start-up cost | Low — start from 1 station | Monthly SaaS, low | High CAPEX, enterprise licensing | Low server, high integration cost |
| Retrofit without PLC | ✓ Status Deck — no invasive work | ✓ Dedicated sensors | ✗ Requires HW replacement | ~ Possible with integrator |
| Real-time OEE | ✓ Full A/P/Q from machine data | ✓ OEE specialization | ✓ But needs extra edge HW | ✓ But no native escalations |
| AI & task escalation | ✓ Built-in — alerts, edge AI | ✗ No AI, basic alerts | ✗ External integration | ✗ Manual scripting |
| Full IIoT platform | ✓ Edge + cloud + MES + CMMS | ✗ OEE layer only | ✓ Broad but costly & complex | ~ SCADA + HMI, no upper layer |
| Mobile shop-floor app | ✓ iOS/Android, native | ✓ Operator tablet | ~ Limited, requires license | ✗ Desktop-first |
| Vendor lock-in | ✗ Open API, no lock-in | ~ SaaS with own HW | ✓ HW + closed ecosystem | ✓ Integrator + custom scripting |
| Local support | ✓ Local team | ✗ No local support | ✗ Via distributor | ✗ No direct support |
Comparison based on publicly available data, user reviews (G2, Gartner), and deployment experience. ✓ = yes / ✗ = no / ~ = partial
GET STARTED
See it vs. test it on your line.
Two entry paths: demo (no installation) and pilot (real data + report).
Online demo
Step into a sample factory: dashboards, alerts, tasks, and operator views — no hardware and no installation.
On-site pilot
We run a setup on 1–3 workstations or a single line. You get data, insights, and a scaling recommendation.
KNOWLEDGE BASE
Masterclass, Factory on Air, and implementation know-how.
Materials that shorten the decision cycle and help you prepare a pilot without chaos.
DBR77 Masterclass
IIoT implementation step by step: KPIs, data, integrations, pilot, and scaling.
See resources →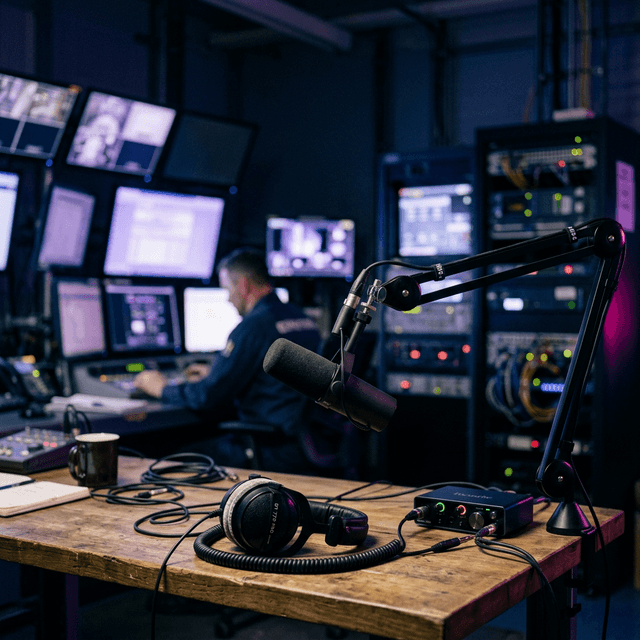
Factory on Air
Real conversations and shop-floor case studies: what works, what doesn’t, and how to measure impact.
See resources →
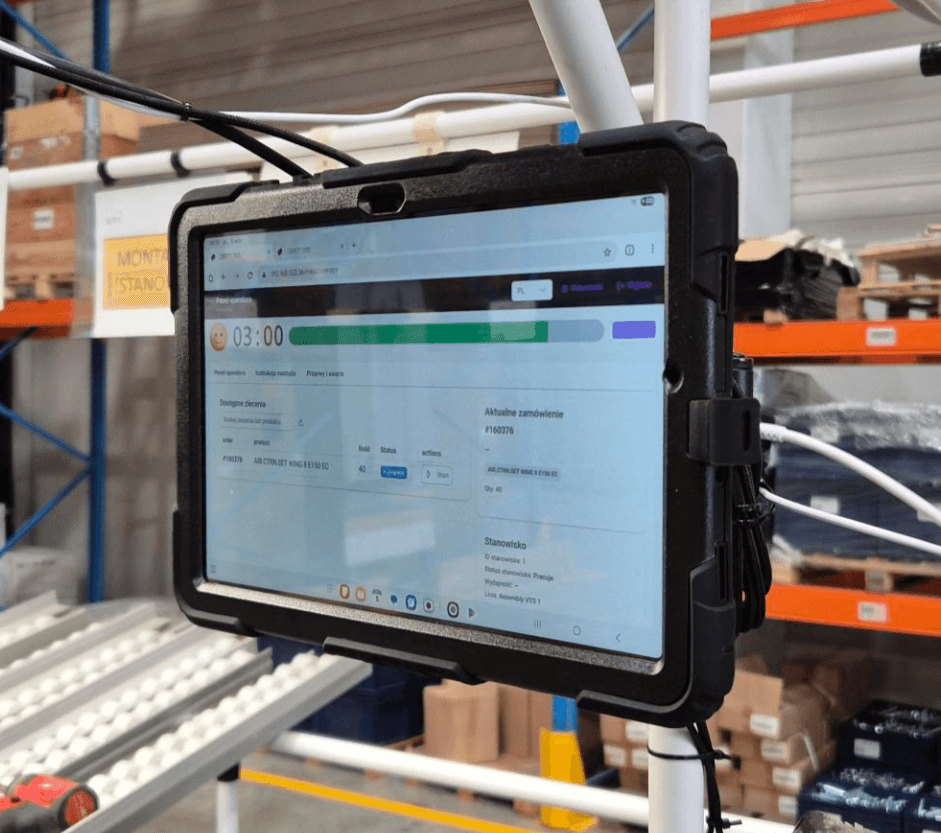
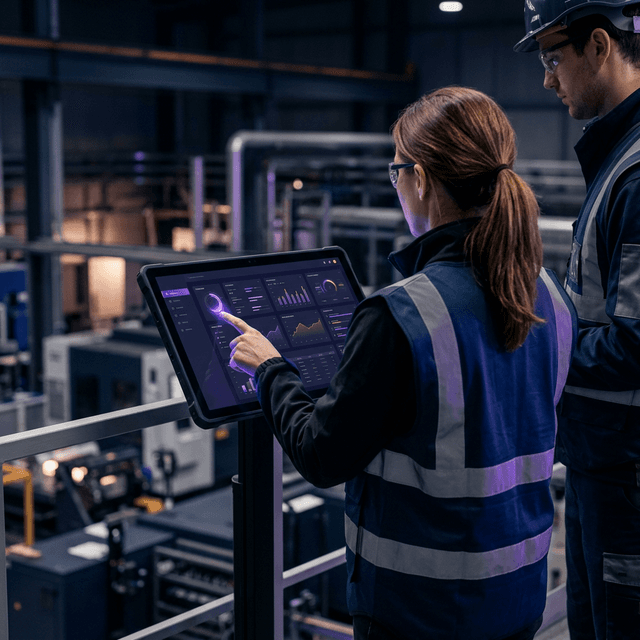
Operator app for tablet and phone
See what the operator should see in one mobile window: plan, live status, defect capture, downtime reasons, and escalation.
Explore pageOEE improvement and ROI calculator
Model recovered hours, added throughput, payback period, and ROI using a market-validated manufacturing calculator.
Explore pageDemo vs trial explained
Understand the difference between a cloud demo for functional evaluation and an on-site trial with physical IIoT modules.
Explore pageKNOWLEDGE BASE
Discover Our Expertise
50 practitioner articles on IIoT adoption in brownfield manufacturing — from first pilot to plant-wide standard.

How to Reduce Downtime Faster with Real-Time Data
Real-time data can reduce downtime materially when it helps the plant identify causes faster, escalate faster, and react within the same shift.
Read article →
How to Choose the Right First IIoT Use Case
The right first IIoT use case is the one with a repeated loss pattern, a clear response gap, and a practical path to prove better control quickly.
Read article →
What IoT Governance Should Look Like After the First Year
Year one is momentum: demos, first lines, quick wins. Year two is gravity: audits, personnel moves, and the discovery that informal rules do not survive normal plant chaos.
Read article →Free resources on IIoT strategy, deployment, and operations
Don’t buy blind.
See the demo without installing anything — or let us prove the value with a pilot on your line.