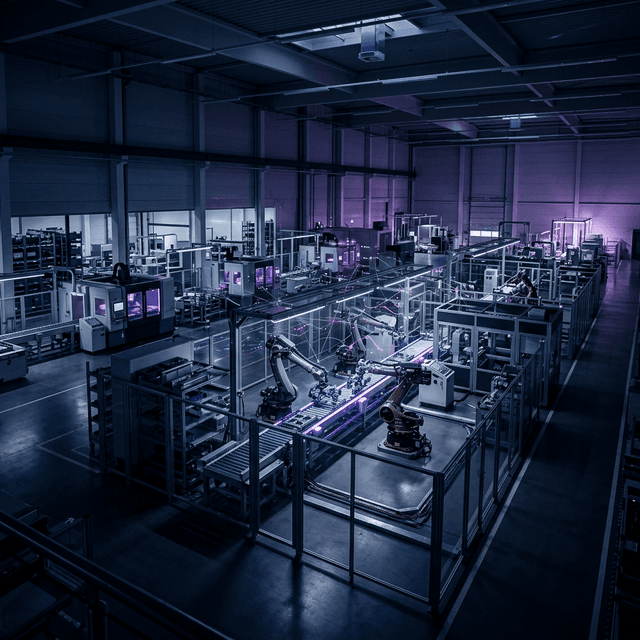
Ihre Fabrik in Echtzeit.
Hardware + Software in einem Ökosystem.
Erfassen Sie Daten aus Maschinen und Sensoren, automatisieren Sie Stillstandsdeklarationen, nutzen Sie Edge‑AI und machen Sie aus Signalen konkrete Aktionen in der Produktion.
Keine Hardware im Demo. Der Pilot läuft auf 1–3 Arbeitsplätzen oder einer Linie.
KOMMT IHNEN DAS BEKANNT VOR?
Ihre Fabrik läuft — aber wie viel verliert sie?
Werke, die nicht in Echtzeit messen, verlieren 20–30 % OEE durch Ursachen, die innerhalb derselben Schicht niemand sauber erklären kann.
Stillstand ohne Grund — 200 bis 1.000 EUR pro Stunde verloren
Die Maschine stoppt. Der Operator wählt "Sonstiges". Erst nach der Schicht schaut jemand in Excel nach. Die eigentliche Ursache erreicht nie die Person, die sie beseitigen könnte.
Daten mit einer Woche Verzögerung
Der Bericht von letzter Woche hilft heute Morgen nicht weiter. SCADA sammelt Daten, eskaliert aber nicht und weist keine Aufgaben zu. Entscheidungen kommen zu spät.
Retrofit ohne CAPEX scheinbar unmöglich
Enterprise-IIoT-Plattformen verlangen oft Infrastrukturaustausch oder monatelange Projekte. Bestandsmaschinen? Eigenes Projekt, eigenes Budget, eigener Integrator.
Der Operator weiß nicht, ob das Ziel erreicht wird
Kein Feedback in Echtzeit bedeutet keine Motivation zur Verbesserung. Operatoren beenden ihre Schicht, ohne zu wissen, was schiefgelaufen ist. Die Probleme wiederholen sich in der nächsten Schicht.
Schätzungen auf der Grundlage von Branchen-Benchmarks und den Ergebnissen von Pilotprojekten.
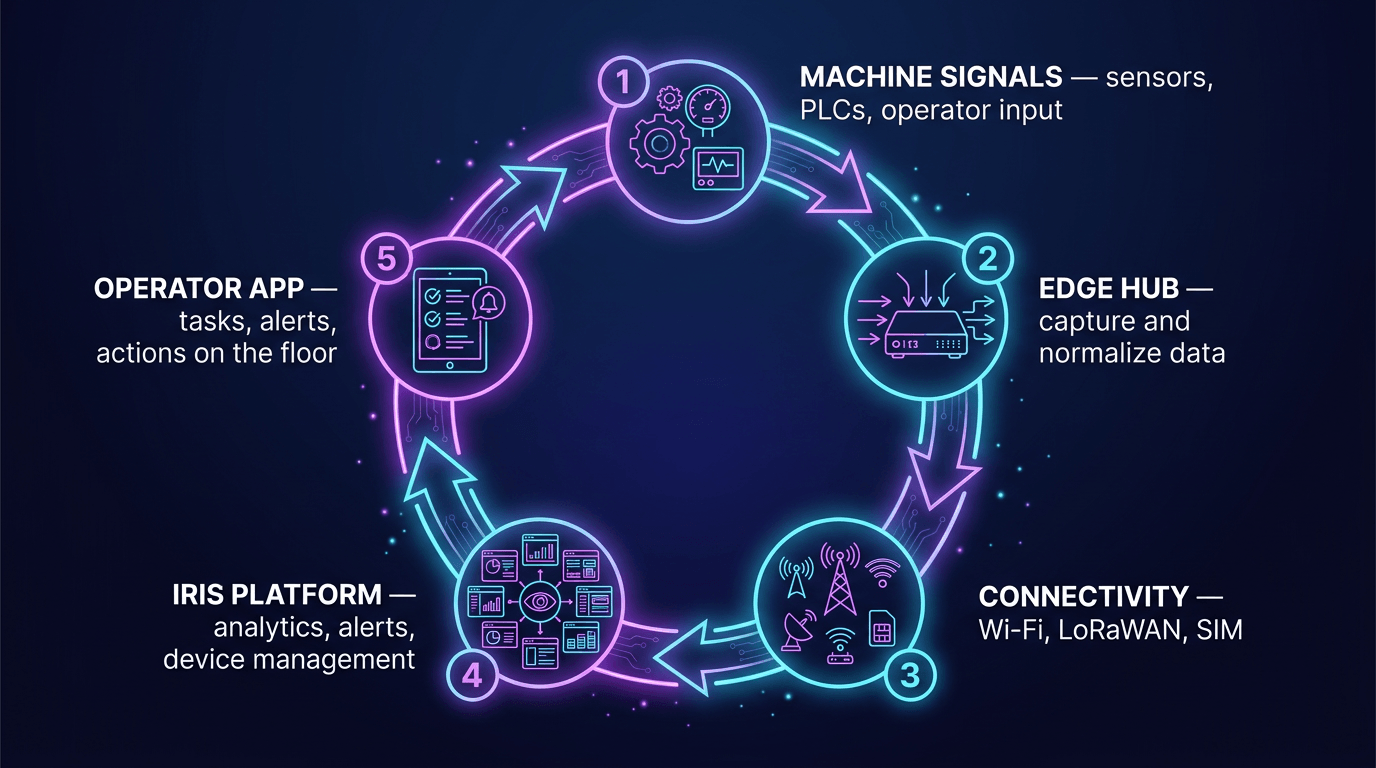
SO FUNKTIONIERT ES
Von der Maschine zur Umsetzung – in drei Schritten.
Sie benötigen weder monatelange Projektarbeit noch eine Erneuerung der Infrastruktur. DBR77 IIoT ist bereits ab dem ersten Tag des Pilotprojekts einsatzbereit.
Verbinden
Status Deck lässt sich innerhalb weniger Minuten an jeder Maschine montieren – ganz ohne SPS und ohne IT-Projekt. Der Data Hub erfasst Signale von mehreren Maschinen und Protokollen gleichzeitig.
Messen
OEE, Verfügbarkeit, Leistung und Qualität werden automatisch in Echtzeit berechnet. Der Bediener erfasst den Grund für den Stillstand – mit einem Fingertipp auf dem Tablet.
Handeln
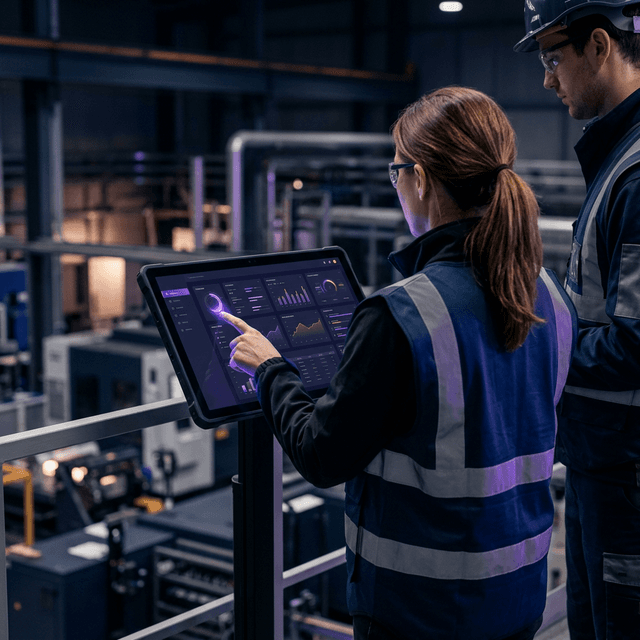
Warnmeldungen werden noch vor Schichtende an das Bedien- und Wartungspersonal weitergeleitet. Die Führungskräfte können den Status jeder Maschine in Echtzeit einsehen. Berichte werden automatisch erstellt.
ERGEBNISSE
Information und Verkauf in einem: erst der Effekt, dann die Architektur.
DBR77 IIoT sammelt Produktionsdaten und ermöglicht schnelle Entscheidungen: Status, Alerts und Erkenntnisse.
Keine „unbekannten Stillstände“ mehr
Erfassen Sie echte Verlustgründe (Operator‑Deklarationen + Signale) und reagieren Sie schneller mit Alerts.
Zuverlässige OEE
Status, Zyklen und Verluste in Echtzeit — statt Berichte im Nachhinein.
Qualität & Arbeitssicherheit in Echtzeit (Edge)
Vision‑AI kann on‑the‑edge laufen: geringere Latenz und weniger Datenexposition.
Retrofit für Bestandsmaschinen
Status Deck + Data Hub ermöglichen den Start auch ohne moderne SPS oder OPC‑UA.
Ein Daten‑Backbone
MQTT/Modbus/RS485/LoRaWAN/Wi‑Fi/LTE — konsistenter Datenstrom ohne Infrastrukturtausch.
Daten → Entscheidung → Aktion
Alerts, Eskalation und schnelle Reaktion in der Produktion — ohne manuelle Berichte.
IMPLEMENTIERUNGEN
Werke, die bereits messen.
Anonyme Ergebnisse aus DBR77-IIoT-Pilotprojekten und -Implementierungen in europäischen Produktionsstätten.
Die Grundursachen für 80 % der ungeplanten Ausfallzeiten konnten innerhalb von drei Wochen nach Beginn des Pilotprojekts ermittelt werden. Die OEE stieg innerhalb von vier Monaten von 61 % auf 74 %.
Möbelherstellung
~120 Maschinen, 2 Werke
ROI: ~7 Mon.
Status-Deck an 8 Arbeitsplätzen – manuelle Berichterstellung entfällt. Die Reaktionszeit bei Störungen wurde von 23 auf 6 Minuten verkürzt.
Lebensmittel & Getränke
1 Verpackungslinie
ROI: ~5 Mon.
Data Hub implementiert + ERP-Integration. Mikrostillstände um 34 % reduziert. Echtzeit-Warnmeldungen an die Bediener.
HLK-Hersteller
35 CNC-Maschinen
ROI: ~9 Mon.
Die Namen der Kunden wurden anonymisiert. Die Ergebnisse stammen aus konkreten Pilotprojekten und Implementierungen – sie können je nach Werk variieren.
ARCHITEKTUR
The Loop: vom Signal zur Aktion.
Datenquellen → Edge & Connectivity → IIoT‑Panel → Aktionen (Mobile/Tablet) → kontinuierliche Verbesserung.
KOMPONENTEN
Hardware + Software. Ein Anbieter. Eine Verantwortung.
Starten Sie mit der einfachsten Datenquelle und skalieren Sie später — ohne Lock‑in und ohne Infrastrukturtausch.
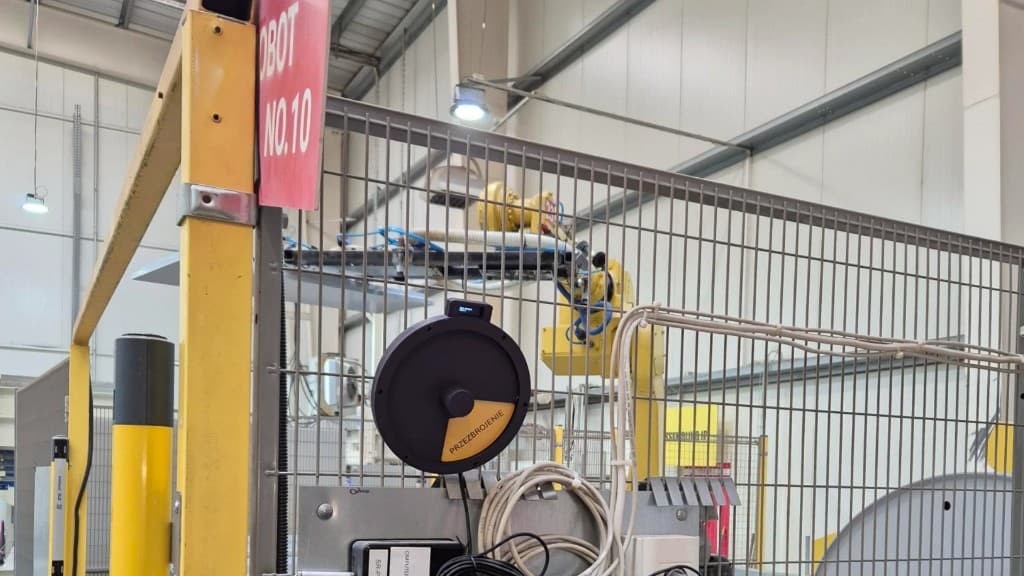
DBR77 Status Deck
HardwareKostengünstiges Gerät zur Zustandsdeklaration: Lauf / Pause / Rüsten / Störung.
- 2 Sekunden zur Wahrheit über Stillstände
- Ideal für Bestandsmaschinen
- Schnelle Installation am Arbeitsplatz
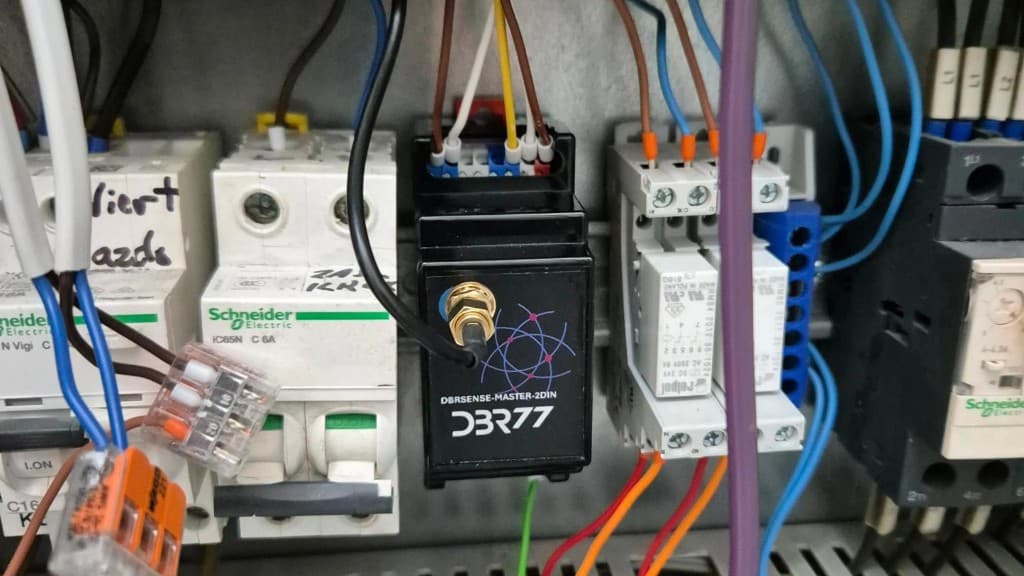
DBR77 Master / Data Hub
HardwareDIN‑Schienen‑Gateway: sammelt Signale, sichert Übertragungsqualität und liefert Daten ins IIoT‑Panel.
- OT‑taugliche Schaltschrank‑Installation
- Multi‑Protokoll (MQTT/Modbus/RS485)
- Reichweite & Stabilität (LoRaWAN/Wi‑Fi/LTE)
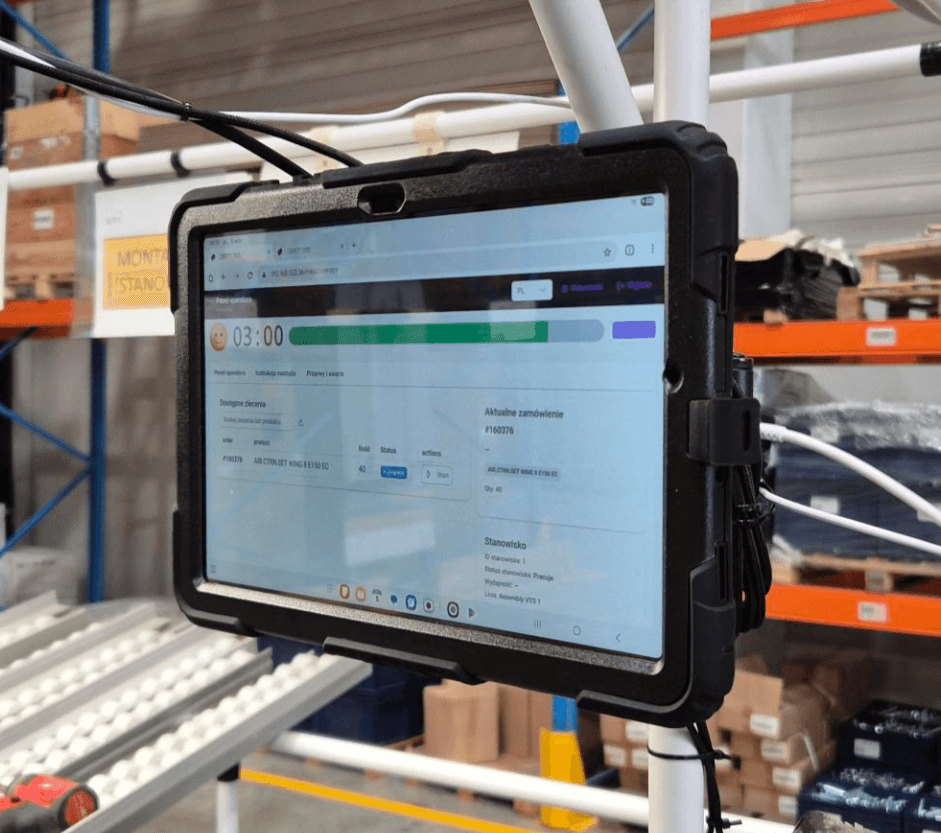
Mobile & Tablet Apps
SoftwareAufgaben, Checklisten und Alerts in der Hand — auf Smartphone und Tablet.
- Aufgaben und Schichtplan
- Benachrichtigungen und Alert‑Bestätigung
- Schnellere Entscheidungen am Shopfloor
DBR77 Vision AI (Edge)
Edge AI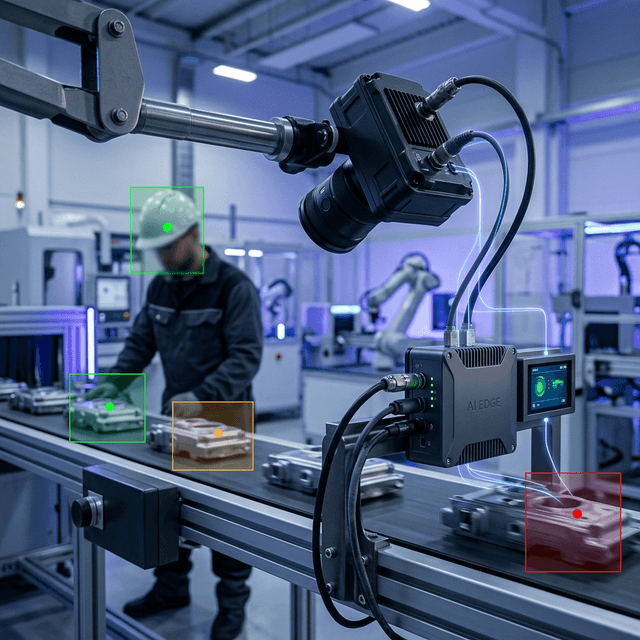
Sicherheit (PPE), Qualitätsdefekte, Präsenz und Prozessanomalien — lokale Verarbeitung, wenn Millisekunden zählen.
- Entscheidungen ohne Verzögerung
- Weniger Daten verlassen das Werk
- Optionale Digital‑Twin‑Integration
Illustrative Grafik — KI-generiert.
VERGLEICH
DBR77 IIoT im Vergleich zum Markt – welche Lösung passt wirklich zu Ihrem Werk?
Käufer vergleichen uns meist mit reinen OEE-Tools (Evocon, Teeptrak) und Unternehmensplattformen (ThingWorx, Cumulocity). Hier erfahren Sie, warum DBR77 den dritten Weg darstellt.
| Merkmal | DBR77 IIoT | OEE-only (Evocon, Teeptrak) | Unternehmensplattform (ThingWorx, Cumulocity) | Enterprise SCADA |
|---|---|---|---|---|
| Bereitstellungszeit | <48 Std. Pilot, Wochen Vollbetrieb | ~1 Std. (nur OEE) | Monate–Jahre, benötigt SI | Wochen + externer Integrator |
| Anlaufkosten | Niedrig – Beginn an einer Station | Monatliche SaaS-Kosten, gering | Hohe Investitionskosten, Unternehmenslizenzen | Geringe Serverkosten, hohe Integrationskosten |
| Nachrüstung ohne SPS | ✓ Status Deck – keine invasiven Eingriffe | ✓ Spezielle Sensoren | ✗ Erfordert einen Hardware-Austausch | ~ Mit Integrator möglich |
| OEE in Echtzeit | ✓ Vollständige A/P/Q aus Maschinendaten | ✓ OEE-Spezialisierung | ✓ Benötigt jedoch zusätzliche Edge-Hardware | ✓ Allerdings keine nativen Eskalationen |
| KI & Aufgaben-Eskalation | ✓ Integriert – Benachrichtigungen, Edge-KI | ✗ Keine KI, einfache Benachrichtigungen | ✗ Externe Integration | ✗ Manuelles Skripting |
| Umfassende IIoT-Plattform | ✓ Edge + Cloud + MES + CMMS | ✗ Nur OEE-Ebene | ✓ Umfassend, aber kostspielig und komplex | ~ SCADA + HMI, keine übergeordnete Ebene |
| Mobile App für die Fertigung | ✓ iOS/Android, nativ | ✓ Bediener-Tablet | ~ Eingeschränkt, erfordert eine Lizenz | ✗ Desktop-orientiert |
| Anbieterbindung | ✗ Offene API, keine Bindung an einen Anbieter | ~ SaaS mit eigener Hardware | ✓ HW + geschlossenes Ökosystem | ✓ Integrator + benutzerdefinierte Skripte |
| Lokaler Support | ✓ Lokales Team | ✗ Kein lokaler Support | ✗ Über einen Vertriebspartner | ✗ Kein direkter Support |
Vergleich auf der Grundlage öffentlich zugänglicher Daten, Nutzerbewertungen (G2, Gartner) und Erfahrungen aus der Praxis. ✓ = ja / ✗ = nein / ~ = teilweise
START
Ansehen vs. auf Ihrer Linie testen.
Zwei Einstiegspfade: Demo (ohne Installation) und Pilot (Echtdaten + Report).
Online-Demo
Beispiel‑Fabrik: Dashboards, Alerts, Aufgaben und Operator‑Views — ohne Hardware und ohne Installation.
Pilot im Werk
Setup auf 1–3 Arbeitsplätzen oder einer Linie. Sie erhalten Daten, Erkenntnisse und eine Skalierungsempfehlung.
WISSENSBASIS
Masterclass, Factory on Air und Implementierungswissen.
Materialien, die Entscheidungen beschleunigen und den Pilot ohne Chaos vorbereiten.
DBR77 Masterclass
IIoT‑Einführung Schritt für Schritt: KPIs, Daten, Integrationen, Pilot und Skalierung.
Ressourcen ansehen →
Factory on Air
Gespräche und Cases aus der Produktion: was funktioniert, was nicht und wie man Wirkung misst.
Ressourcen ansehen →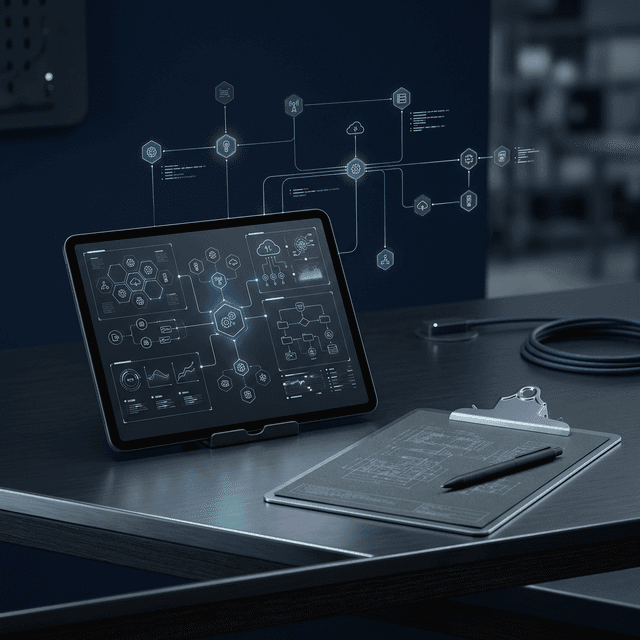
Knowledge Base
Pilot‑Checklisten, OT/IT‑Integrationen, Sicherheit und Best Practices.
Ressourcen ansehen →Operator-App für Tablet und Smartphone
Sehen Sie, was ein Operator in einem mobilen Fenster sehen sollte: Plan, Live-Status, Fehlererfassung, Stillstandsgründe und Eskalation.
Seite öffnenOEE- und ROI-Rechner
Berechnen Sie zurückgewonnene Stunden, zusätzlichen Durchsatz, Payback-Zeit und ROI mit einem marktvalidierten Rechner für die Fertigung.
Seite öffnenDemo vs. Trial erklärt
Verstehen Sie den Unterschied zwischen einer Cloud-Demo zur Funktionsbewertung und einem On-Site-Trial mit physischen IIoT-Modulen.
Seite öffnenWISSENSDATENBANK
Entdecken Sie Unser Fachwissen
50 Expertenbeiträge zur IIoT-Einführung in Brownfield-Fabriken — vom ersten Pilot bis zum werksweiten Standard.

Wie Sie Stillstand schneller mit Echtzeitdaten reduzieren
Echtzeitdaten können Stillstand deutlich verringern, wenn sie dem Werk helfen, Ursachen schneller zu erkennen, schneller zu eskalieren und noch in derselben Schicht zu reagieren.
Artikel lesen →
Wie Sie den richtigen ersten IIoT-Use-Case wählen
Der erste Use Case ist eine Strategieentscheidung, verkleidet als technische Wahl — er lehrt die Organisation, wofür IIoT wirklich da ist.
Artikel lesen →
Wie IoT-Governance nach dem ersten Jahr aussehen sollte
Jahr eins ist Schwung: Demos, erste Linien, Quick Wins. Jahr zwei ist Gravitation: Audits, Personalbewegungen und die Erkenntnis, dass informelle Regeln normales Fertigungschaos nicht überleben.
Artikel lesen →Kostenlose Ressourcen zur IIoT-Strategie, Einführung und dem Betrieb
Nicht blind kaufen.
Sehen Sie die Demo ohne Installation — oder lassen Sie uns den Wert im Pilot auf Ihrer Linie beweisen.