How to Reduce Downtime with Real-Time Data: What Changed on One Packaging Line
DBR77 IoT Team · Published
Real-time data reduces downtime when it shortens the time between a machine stopping and the right person acting on it. On one corrugated-packaging line, making every stop visible as it happened cut the average response time from 24 to 9 minutes and lifted OEE from 61% to 70%.
The machines did not get faster. The plant stopped losing time between the event and the moment anyone knew about it. This article shows where those minutes hide, what changed on that line, and what real-time data will not fix for you.
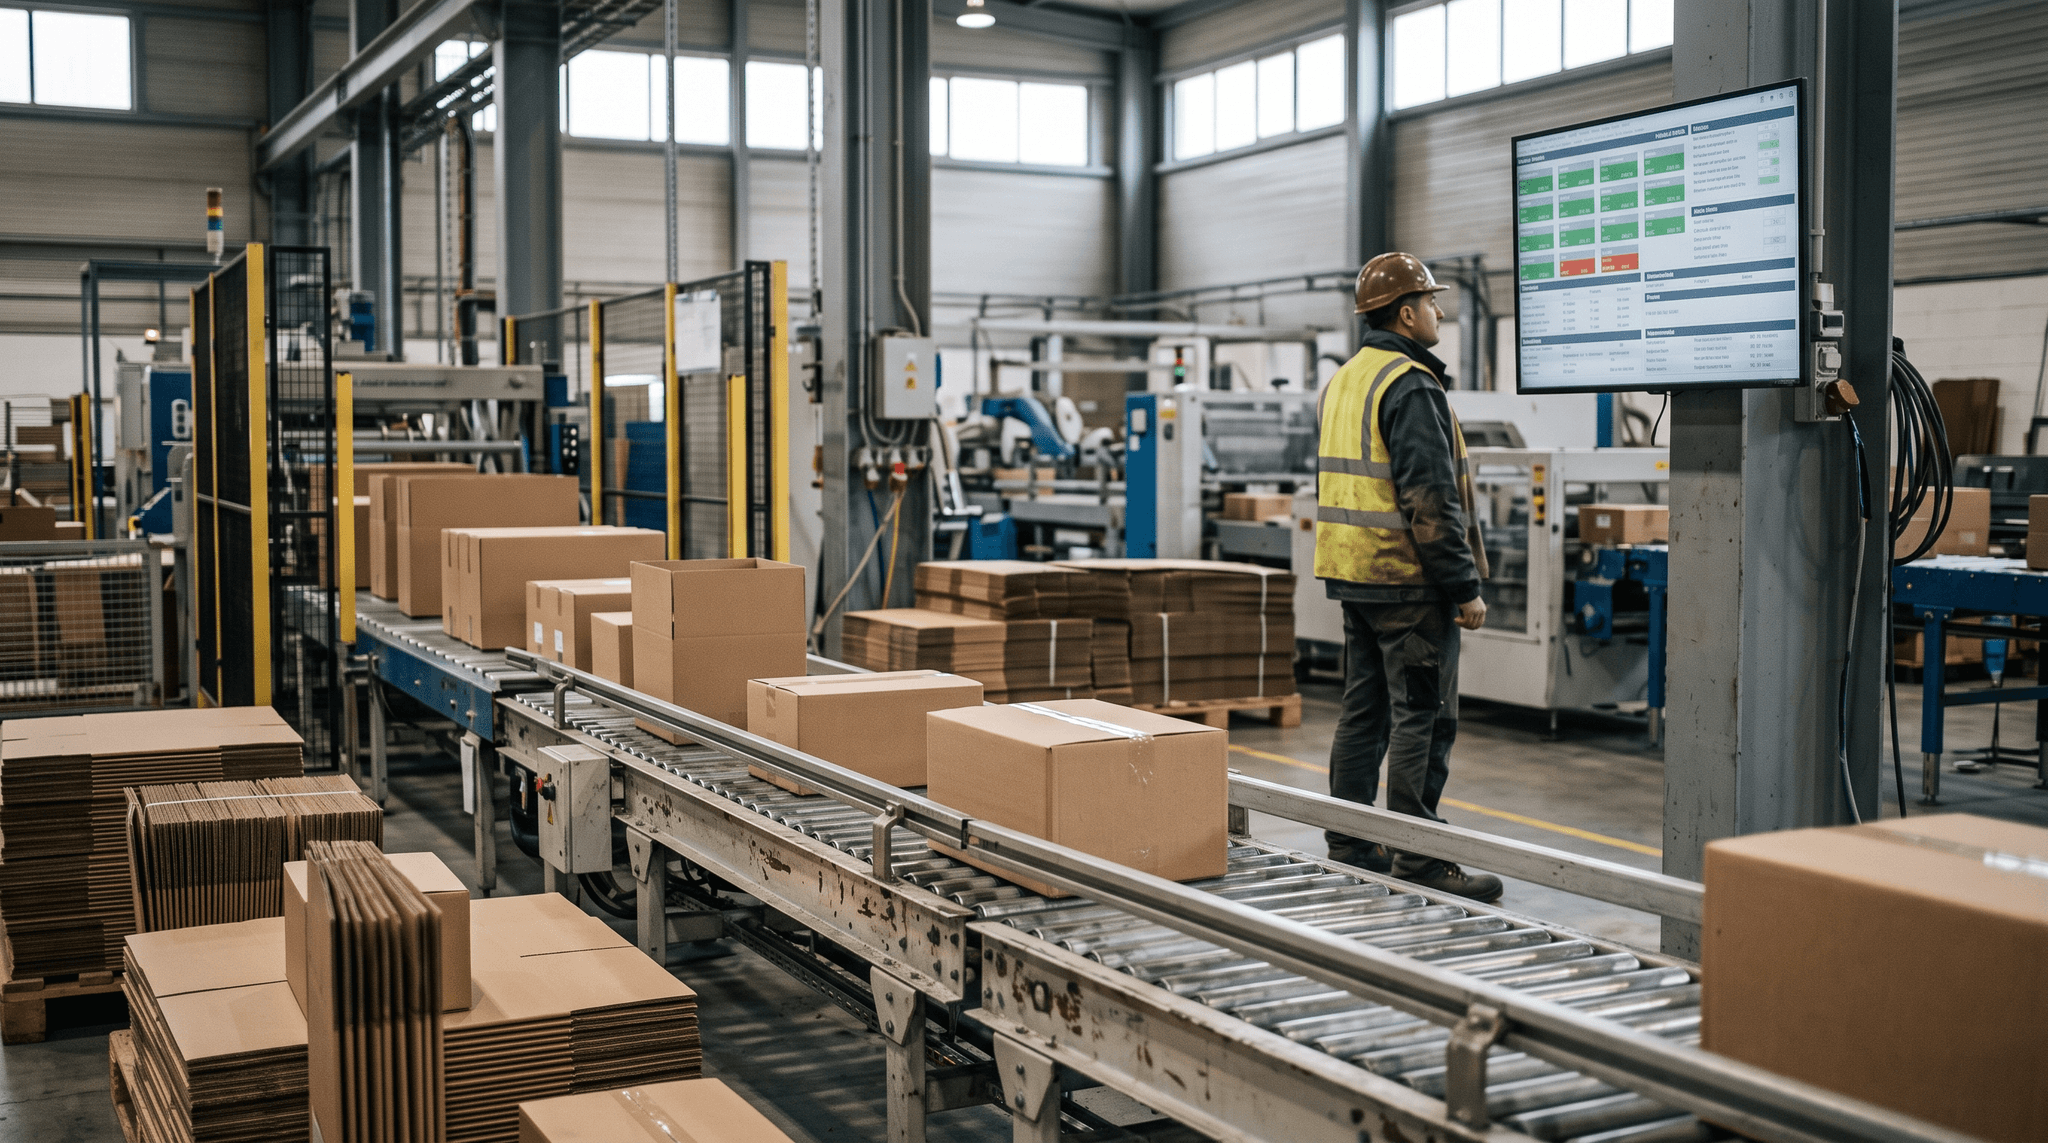
Why downtime is still so expensive
Unplanned downtime is one of the largest hidden costs in manufacturing. Siemens estimates that the world's 500 largest companies lose about 11% of their annual revenue to unplanned downtime, around $1.4 trillion a year. In automotive, one hour of a stopped line costs about $2.3 million (Siemens, The True Cost of Downtime 2024).
A mid-sized plant does not lose millions per hour. But the mechanism is the same. Most of the cost is not the repair itself. It is the time the line stands while people find out that it stopped, why, and who should go.
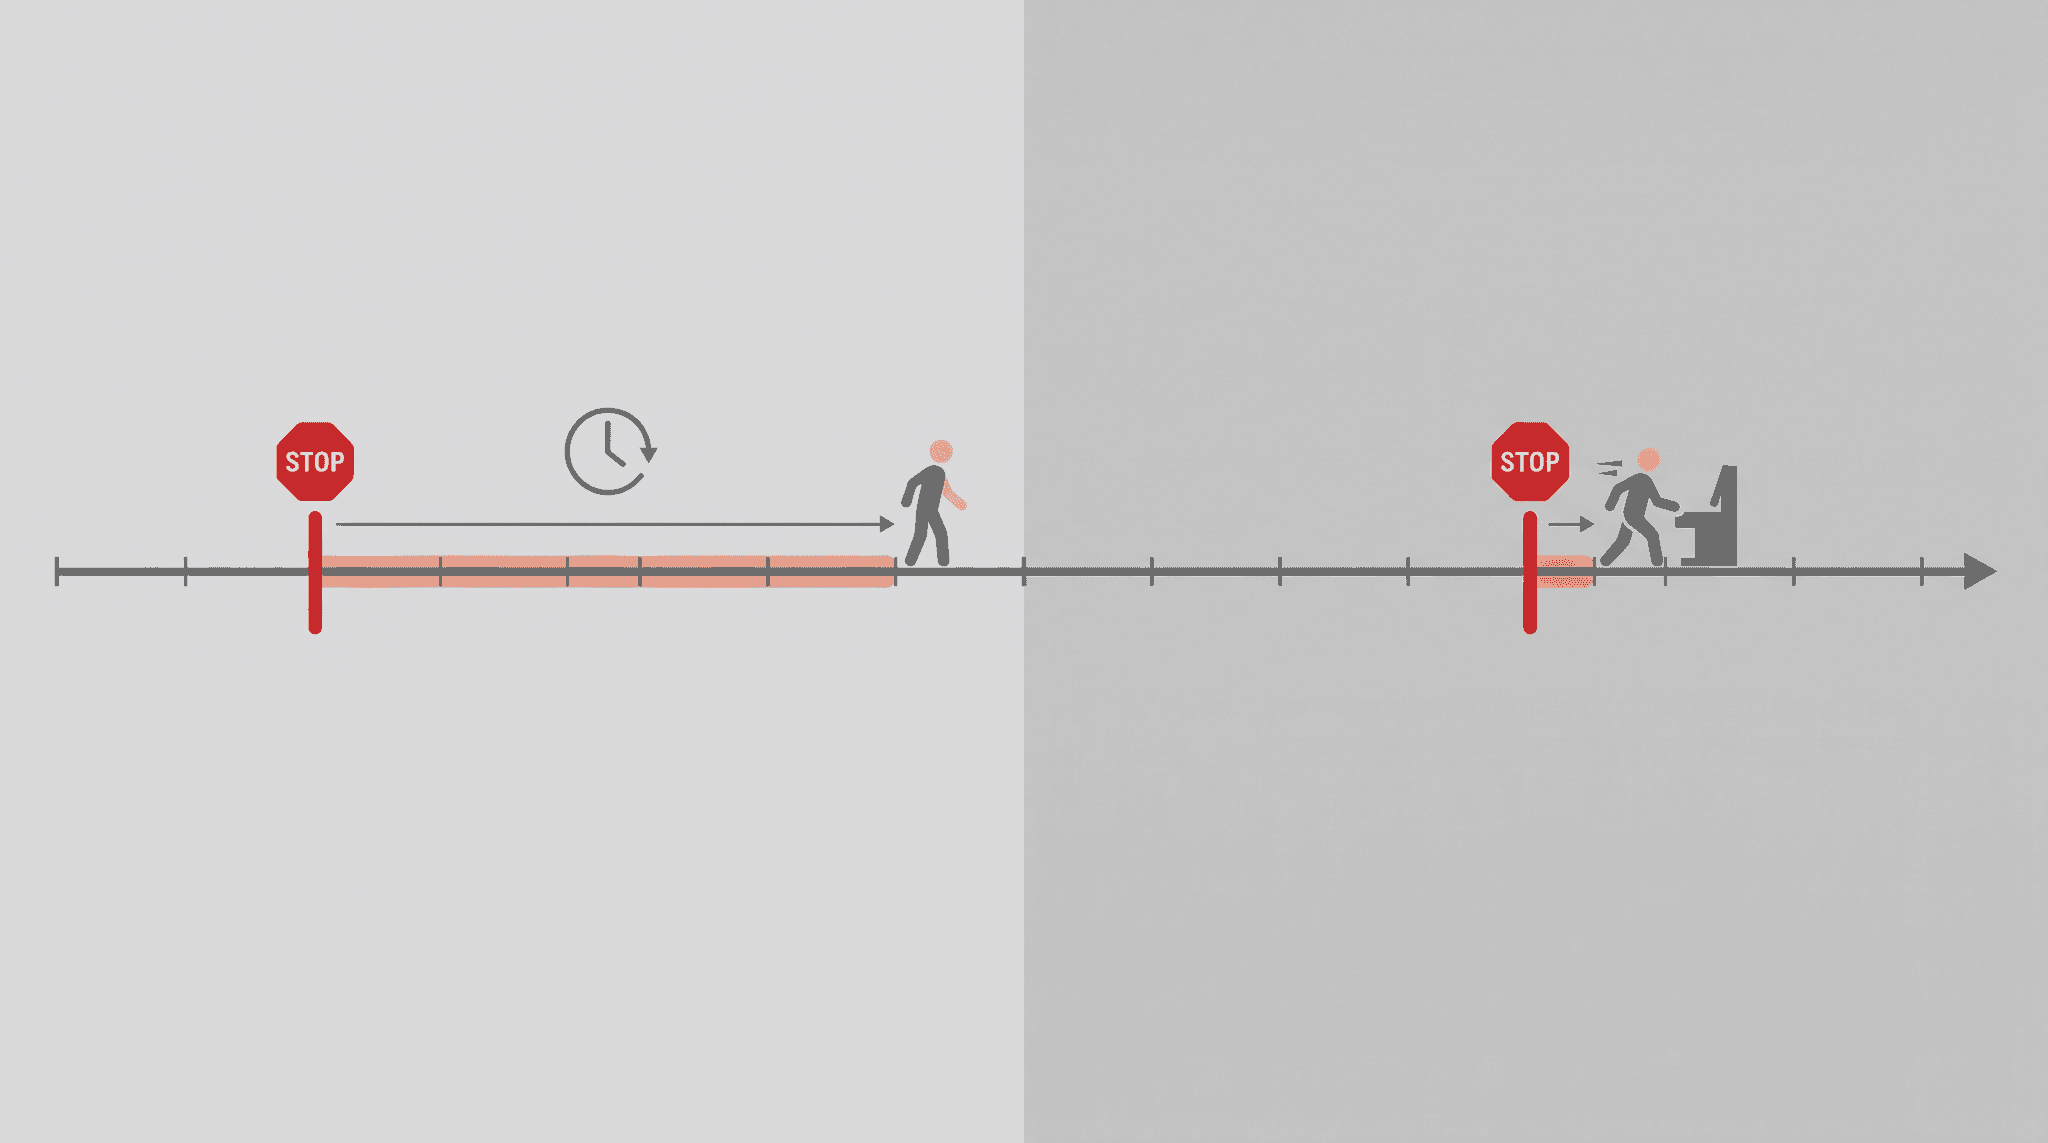
Where the minutes actually go
Take a typical stop on a line without live data. The machine halts. An operator notices, tries to restart, then walks to find the shift leader. The shift leader radios maintenance. Maintenance asks which machine and what the error was. Someone walks back to check.
Very little of that time is spent fixing anything. It is spent noticing, walking, describing and waiting.
| Step in a stop | Without live data | With live data | |---|---|---| | Noticing the stop | When someone walks past or the line backs up | The moment the machine changes state | | Knowing the reason | Guessed later, often logged as "unknown" | Operator picks a reason at the machine in about 2 seconds | | Calling the right person | Radio, phone, walking to find them | Alert goes to the owner of that machine and stop type | | Tracking the response | Not tracked | Time to acknowledge and time to fix are logged | | Learning from it | End-of-shift notes, Excel the next day | Live downtime Pareto by machine and reason |
What changed on the packaging line
The line was modern. The way it was managed was not. Operators logged stops from memory at the end of the shift. "Unknown" was the biggest bar on the downtime Pareto. OEE was rebuilt in a spreadsheet a day later, when nobody could act on it anymore.
The pilot changed four things:
- Live machine status on the floor. Every stop showed up the moment it happened, not in the next morning's report.
- Reason capture at the stop. The operator selected the reason on a tablet next to the machine, in about two seconds, while the cause was still obvious.
- Every alert became a task with an owner. Maintenance did not get a radio call. They got a task with the machine, the reason and the time.
- Live OEE. Nobody rebuilt it by hand anymore. It was calculated from the same events.
The result after the pilot, confirmed by the plant: OEE rose from 61% to 70% and average response time to a stop fell from 24 to 9 minutes. We do not name the client.
What would 9 OEE points mean for your line?
Enter your shifts, output and current OEE in the ROI calculator. It takes about three minutes and shows the value of every point of OEE.
Why response time moves before OEE
OEE multiplies availability, performance and quality. Vorne, which publishes OEE benchmarks, notes that 85% is often cited as world class, while most manufacturers are closer to 60%. The packaging line started right at that typical level.
OEE is an outcome. You cannot change it directly on Tuesday afternoon. Response time is different. It is under your control the moment the floor becomes visible. Every stop that gets an owner in one minute instead of ten adds availability, stop after stop, shift after shift.
That is why the first number to watch in a pilot is response time, not OEE. On the packaging line the 15 minutes saved per stop were minutes of searching, not fixing. The nine OEE points followed from that, together with "unknown" disappearing from the Pareto.
Five conditions that make real-time data cut downtime
Live data alone changes nothing. Plenty of plants have dashboards that nobody acts on. In our experience, downtime falls only when these five conditions are in place:
- A signal from every machine in scope. Machines with a PLC are read directly, older ones get a small edge device. Our article on the first 30 days of IoT in a brownfield factory shows how.
- The reason is captured at the stop. Reasons reconstructed at the end of the shift are guesses. Keep the list short, 10 to 15 reasons per machine type.
- One owner per alert. An alert sent to "maintenance" is sent to nobody. Route it to a person or a role on the current shift.
- An escalation rule. For example: if an alert is not acknowledged within 5 minutes, it goes to the shift leader. Write the rule down before go-live.
- A short daily review. Ten minutes at the start of the shift on the top three losses from the day before. This is where the data turns into decisions.
What real-time data will not fix
Real-time monitoring makes losses visible and speeds up the reaction. It does not remove root causes on its own. A worn bearing still needs replacing, and a bad changeover standard still needs rewriting. The data tells you which of them costs the most.
It is also not predictive maintenance. Predicting failures needs a longer history and more signals, and it pays off on a smaller number of critical assets. Start with visibility. It gives you the clean event history that any later prediction depends on.
Finally, some stations have no signal at all: manual assembly, packing, older presses. For those, a camera can act as a sensor. The IRIS Vision AI layer measures cycles and presence without wiring into the machine.
FAQ
How much can real-time data reduce downtime?
It depends on how much time your plant loses between a stop and a response today. On the packaging line described above, response time fell from 24 to 9 minutes and OEE rose by 9 points. Plants that already react quickly will see smaller gains.
Do we need new machines or new PLCs?
No. Machines with a PLC are read over OPC UA or Modbus. Machines without a PLC get a small edge device that reads the signals that are available. The line keeps running during installation.
How quickly can we see results?
Response time is measurable from the first week, because every stop and every reaction is time-stamped. OEE changes become visible over the following weeks, once reasons are captured consistently.
What is the difference between real-time monitoring and predictive maintenance?
Monitoring shows what is happening now and speeds up the response. Predictive maintenance forecasts failures from historical data. Monitoring comes first, because it creates the data history that prediction needs.
What does a pilot involve?
One line, a few weeks, measured against a baseline. See how a DBR77 IoT pilot works, or calculate the expected value first in the ROI calculator.
Conclusion
Downtime rarely falls because people start running. It falls when the delay between an event and the knowing disappears. On one packaging line, that meant 15 fewer minutes per stop and nine more points of OEE. Start with one line, measure response time first, and let OEE follow.
See it on a live line
In a 30-minute online demo we show how stops, reasons and alerts look in DBR77 IoT, and how a pilot on one of your lines would be measured.
Sources
- Institute for Supply Management, The Monthly Metric: Unscheduled Downtime (summary of Siemens data), 2024
- Siemens, The True Cost of Downtime 2024
- Vorne, World-Class OEE
- Vorne, The Six Big Losses
- McKinsey & Company, IoT value set to accelerate through 2030
- OPC Foundation, What is OPC UA
- DBR77 IoT pilot data, corrugated-packaging line (client anonymous), 2026