Energy and utilities: consumption and cost as it happens
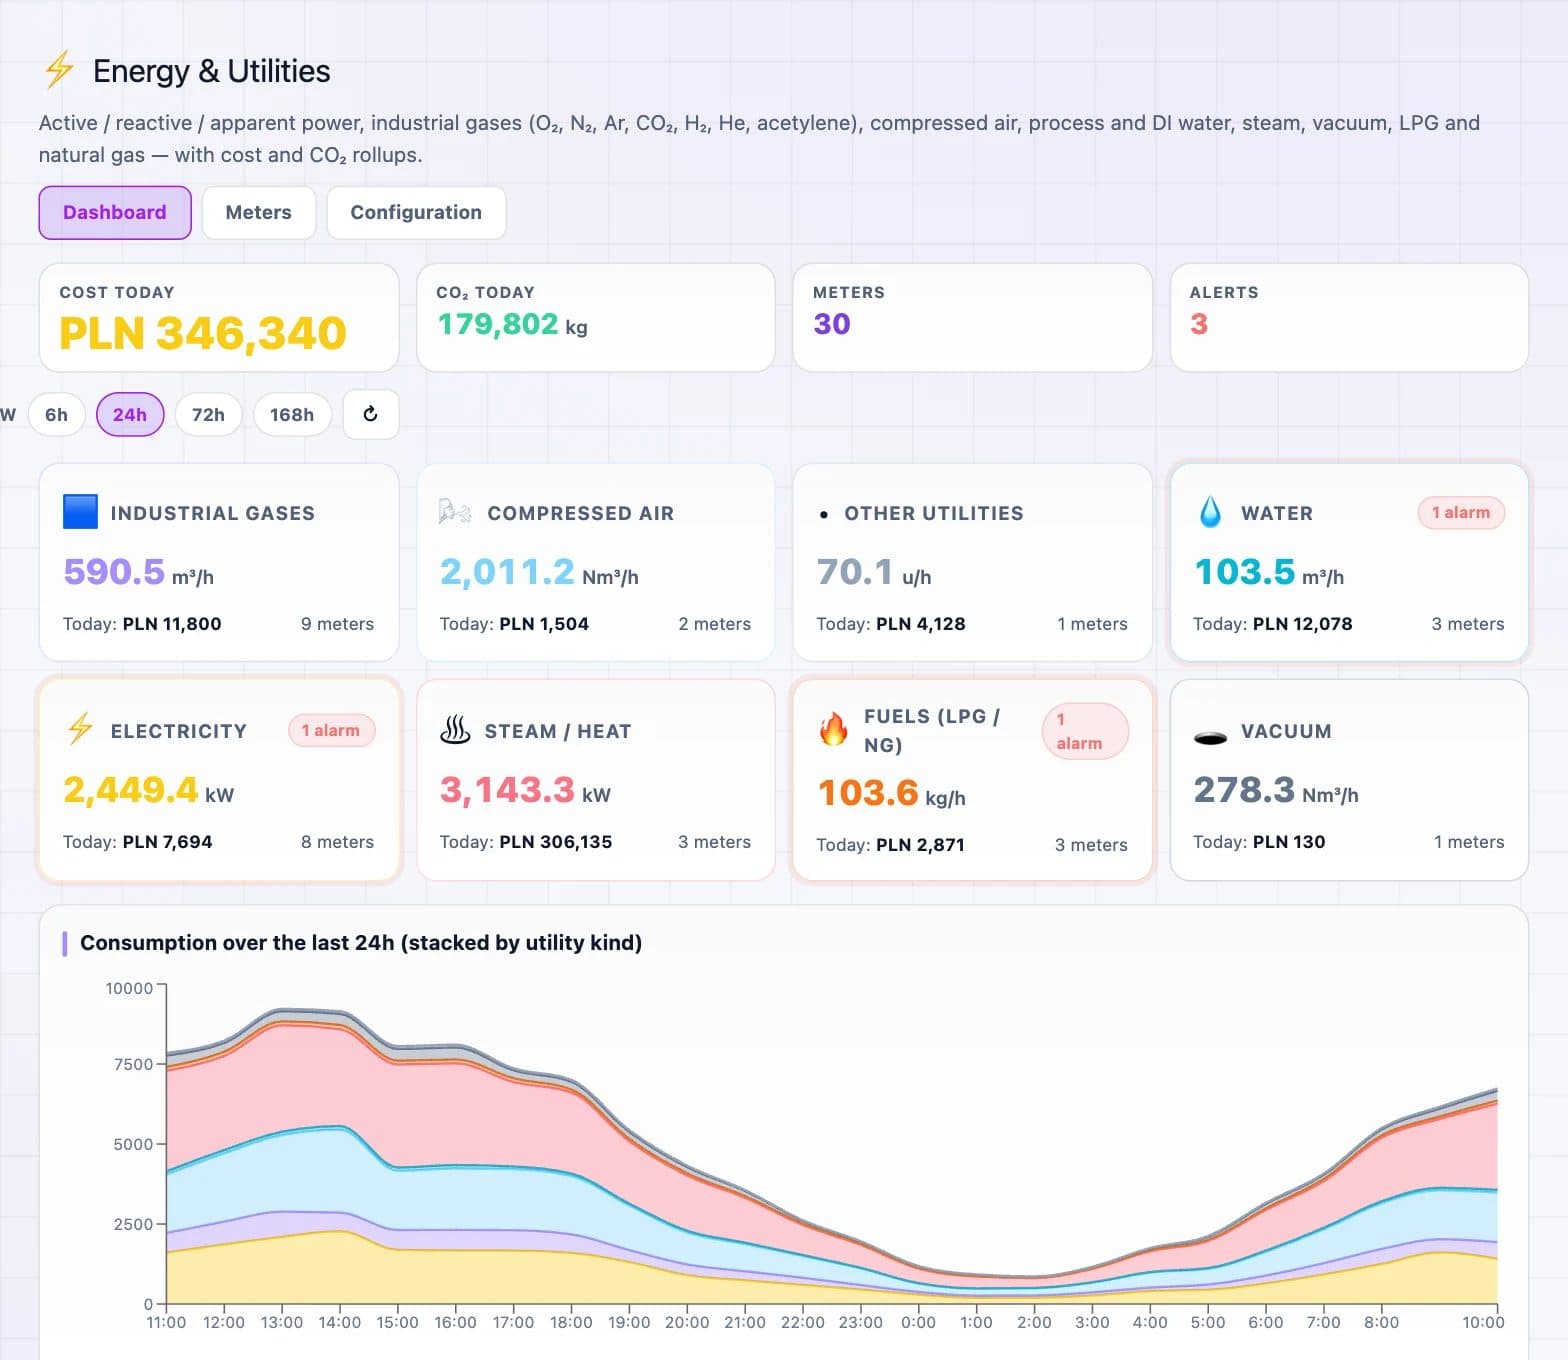
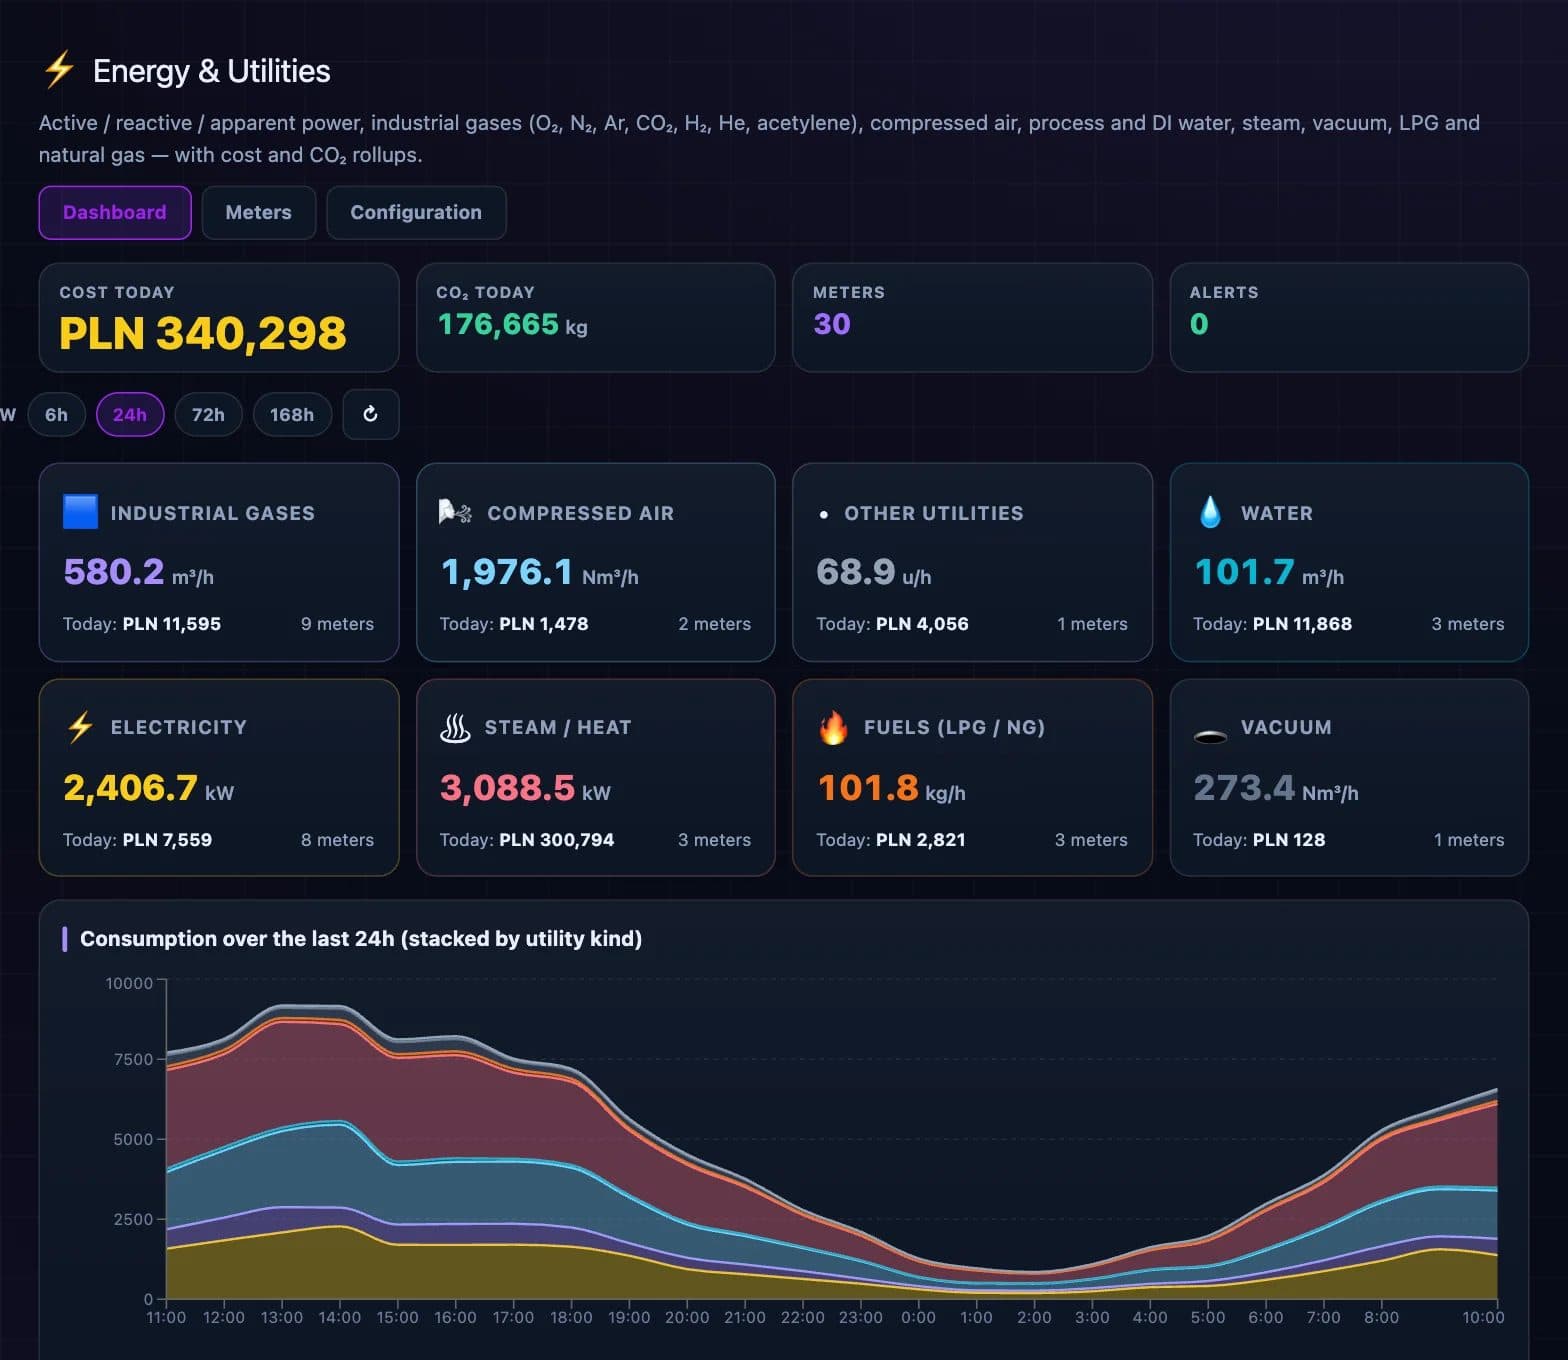
Meters for electricity, compressed air, technical gases, water, heat, fuels and vacuum feed one dashboard. Each medium has its unit, tariff and CO₂ factor, so consumption turns into cost and emissions.
WHAT IT DOES
Every medium, its cost and its emissions
All media on one screen
Active, reactive and apparent power, compressed air, industrial gases, water, steam and heat, fuels and vacuum, each in its own unit.
Consumption turned into cost
A tariff per medium turns consumption into money: today's cost in total and per medium.
CO₂ per medium
Where it applies, a CO₂ factor converts consumption into emissions, which IRIS ESG can use for environmental reporting.
Consumption over time
A stacked chart shows consumption by medium for the last 6, 24, 72 or 168 hours, so you can compare production hours with nights and weekends.
Top consumers and cost split
See which meters cost the most today and how the cost splits between media.
Alarms on consumption
Meter readings use the same alarm rules as machine signals.
HOW IT STARTS
From meters to cost per day
- 01
Connect the meters
Meters with Modbus, like the main feed meter in the demo factory, connect through the MasterHub gateway or Data Bridge.
- 02
Set tariffs and CO₂ factors
One tariff and one factor per medium turn readings into cost and emissions.
- 03
Review the cost per day
Compare media, meters and periods and find consumption that has no production behind it.
What energy monitoring is for
It shows where and when media are used and what they cost. Billing still comes from the utility's own meters.
Related parts of DBR77 IIoT
See what your media cost per hour
Explore the energy dashboard in the online demo, or connect your main meters in a pilot.